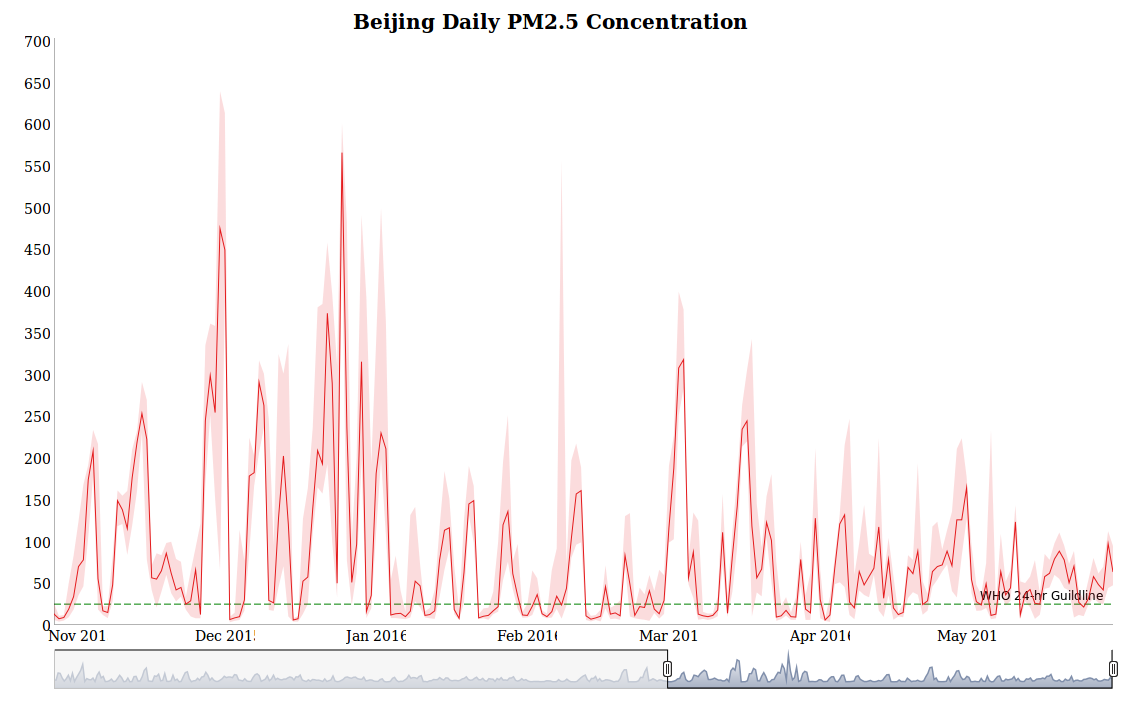
Beijing PM2.5 Concentration History 2015-2016
Plotted with R package dygraphs.
Jul 13, 2016 · 20 words · 1 minute read
Plotted with R package dygraphs. (Click the image to access the interactive version)
Plotted with R package dygraphs. (Click the image to access the interactive version)