
I’m starting to think prediction interval[1] should be a required output of every real-world regression model. You need to know the uncertainty behind each point estimation. Otherwise the predictions are often not actionable.
For example, consider historical sales of an item under a certain circumstance are (10000, 10, 50, 100). Standard least squares method gives you an estimate of 2540. If you restock based on that prediction, you’re likely going to significantly overstock 75% of the time. The prediction is almost useless. But if you estimate the quantiles of the data distribution, the estimated 5th, 50th, and 95th percentiles are 16, 75, 8515, which are much more informative than the 2540 single estimation. It is also the idea of quantile regression.
In this series we’re going to learn about how quantile regression works, and how to train quantile regression models in Tensorflow, Pytorch, LightGBM, and Scikit-learn. It has been an enlightening experience for me, as I discovered a lot of concepts which I thought I understand but actually didn’t.
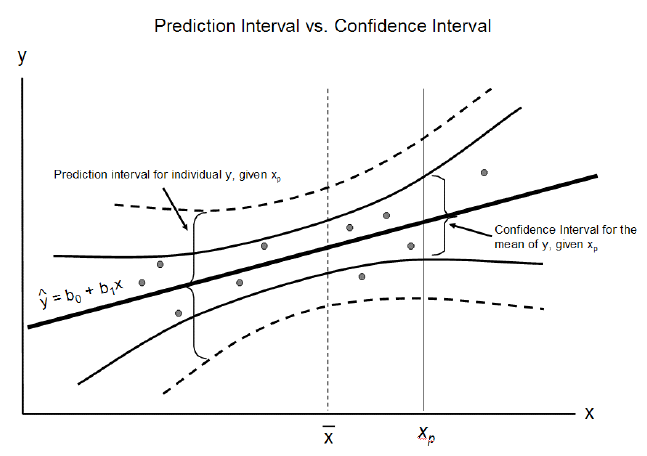
Prediction Interval v.s. Confidence Interval [1]
Confidence interval is a Frequentist idea. The Bayesian counterpart is credible interval. These two are interchangeable here as they represent the same kind of uncertainty.
-
Confidence interval: predicts the distribution of estimates of the true population mean or other quantity of interest that cannot be observed.
-
Prediction interval: predicts the distribution of individual future points.
Prediction interval takes both the uncertainty of the point estimate and the data scatter into account. So a prediction interval is always wider than a confidence interval.[2]
Using simple linear regression as an example, its confidence interval is[3]:
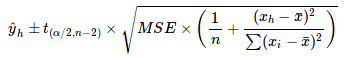
Confidence Interval of SLR (Source)
And its prediction interval is[3]:
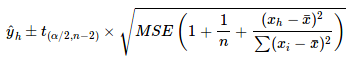
Prediction Interval of SLR (Source)
We can see that the variance of the prediction interval is just the variance of the confidence interval plus the mean square error, which is an estimate of the data scatter.
Quantile Regression
Quantile regression is an expansion to least absolute deviations[4], which tries to minimize the sum of absolute values of the residuals:
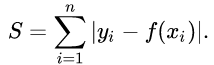
We’ll later see that the solution to this problem is the median of Y|X, in contrast to the mean as in least squares. Or you can check out the neat explanation using derivatives in [5].
Now we change the stuff inside the summation from above to this loss function[6]:
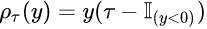
Loss Function of Quantile Regression (Source)
where the big I in the formula is an indicator function, y is the residual, and τ means we want to estimate the τth quantile of y. The value range of τ is (0, 1). If we use τ = 0.5, we’ll have exactly the same thing as in least absolute deviations (besides a constant term 0.5).
(20180716 Edit: I just realized that when τ = 0 or τ = 1 this loss function will have a large range of residuals (<0 or >0) with zero loss. That’s gonna be problematic. So in reality the value range of τ should not include 0 and 1)
Next we sub in the residual (Y-μ) and try to minimize the expected loss (Y is the target random variable, and μ is our estimate, F is the cumulative distribution function.) :

The minimization target (Source)
To minimize it, take the derivatives of the both side and set the left side to zero:
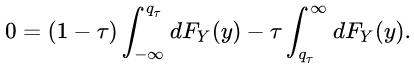
The first integration yields F(q) and the second one yields 1-F(q), which lead to:
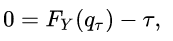
Therefore the solution q_τ is exactly the τth quantile of Y:
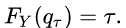
(The above basically followed the derivation on Wikipedia[6], but explained in my language.)
With τ = 0.5, this shows that the solution of least absolute deviations is the median of the target variable.
To Be Continued
We’ve discuss the theoretical aspect of quantile regression. In the next post we’re going to see how to implement it in Tensorflow, PyTorch, LightGBM and scikit-learn.
Part 2 - An Overview of Tensorflow, Pytorch, LightGBM implementations