
Introduction
The Tensorflow Profiler in the upcoming Tensorflow 2.2 release is a much-welcomed addition to the ecosystem. For image-related tasks, often the bottleneck is the input pipeline. But you also don’t want to spend time optimizing the input pipeline unless it is necessary. The Tensorflow Profiler makes pinpointing the bottleneck of the training process much easier, so you can decide where the optimization effort should be put into.
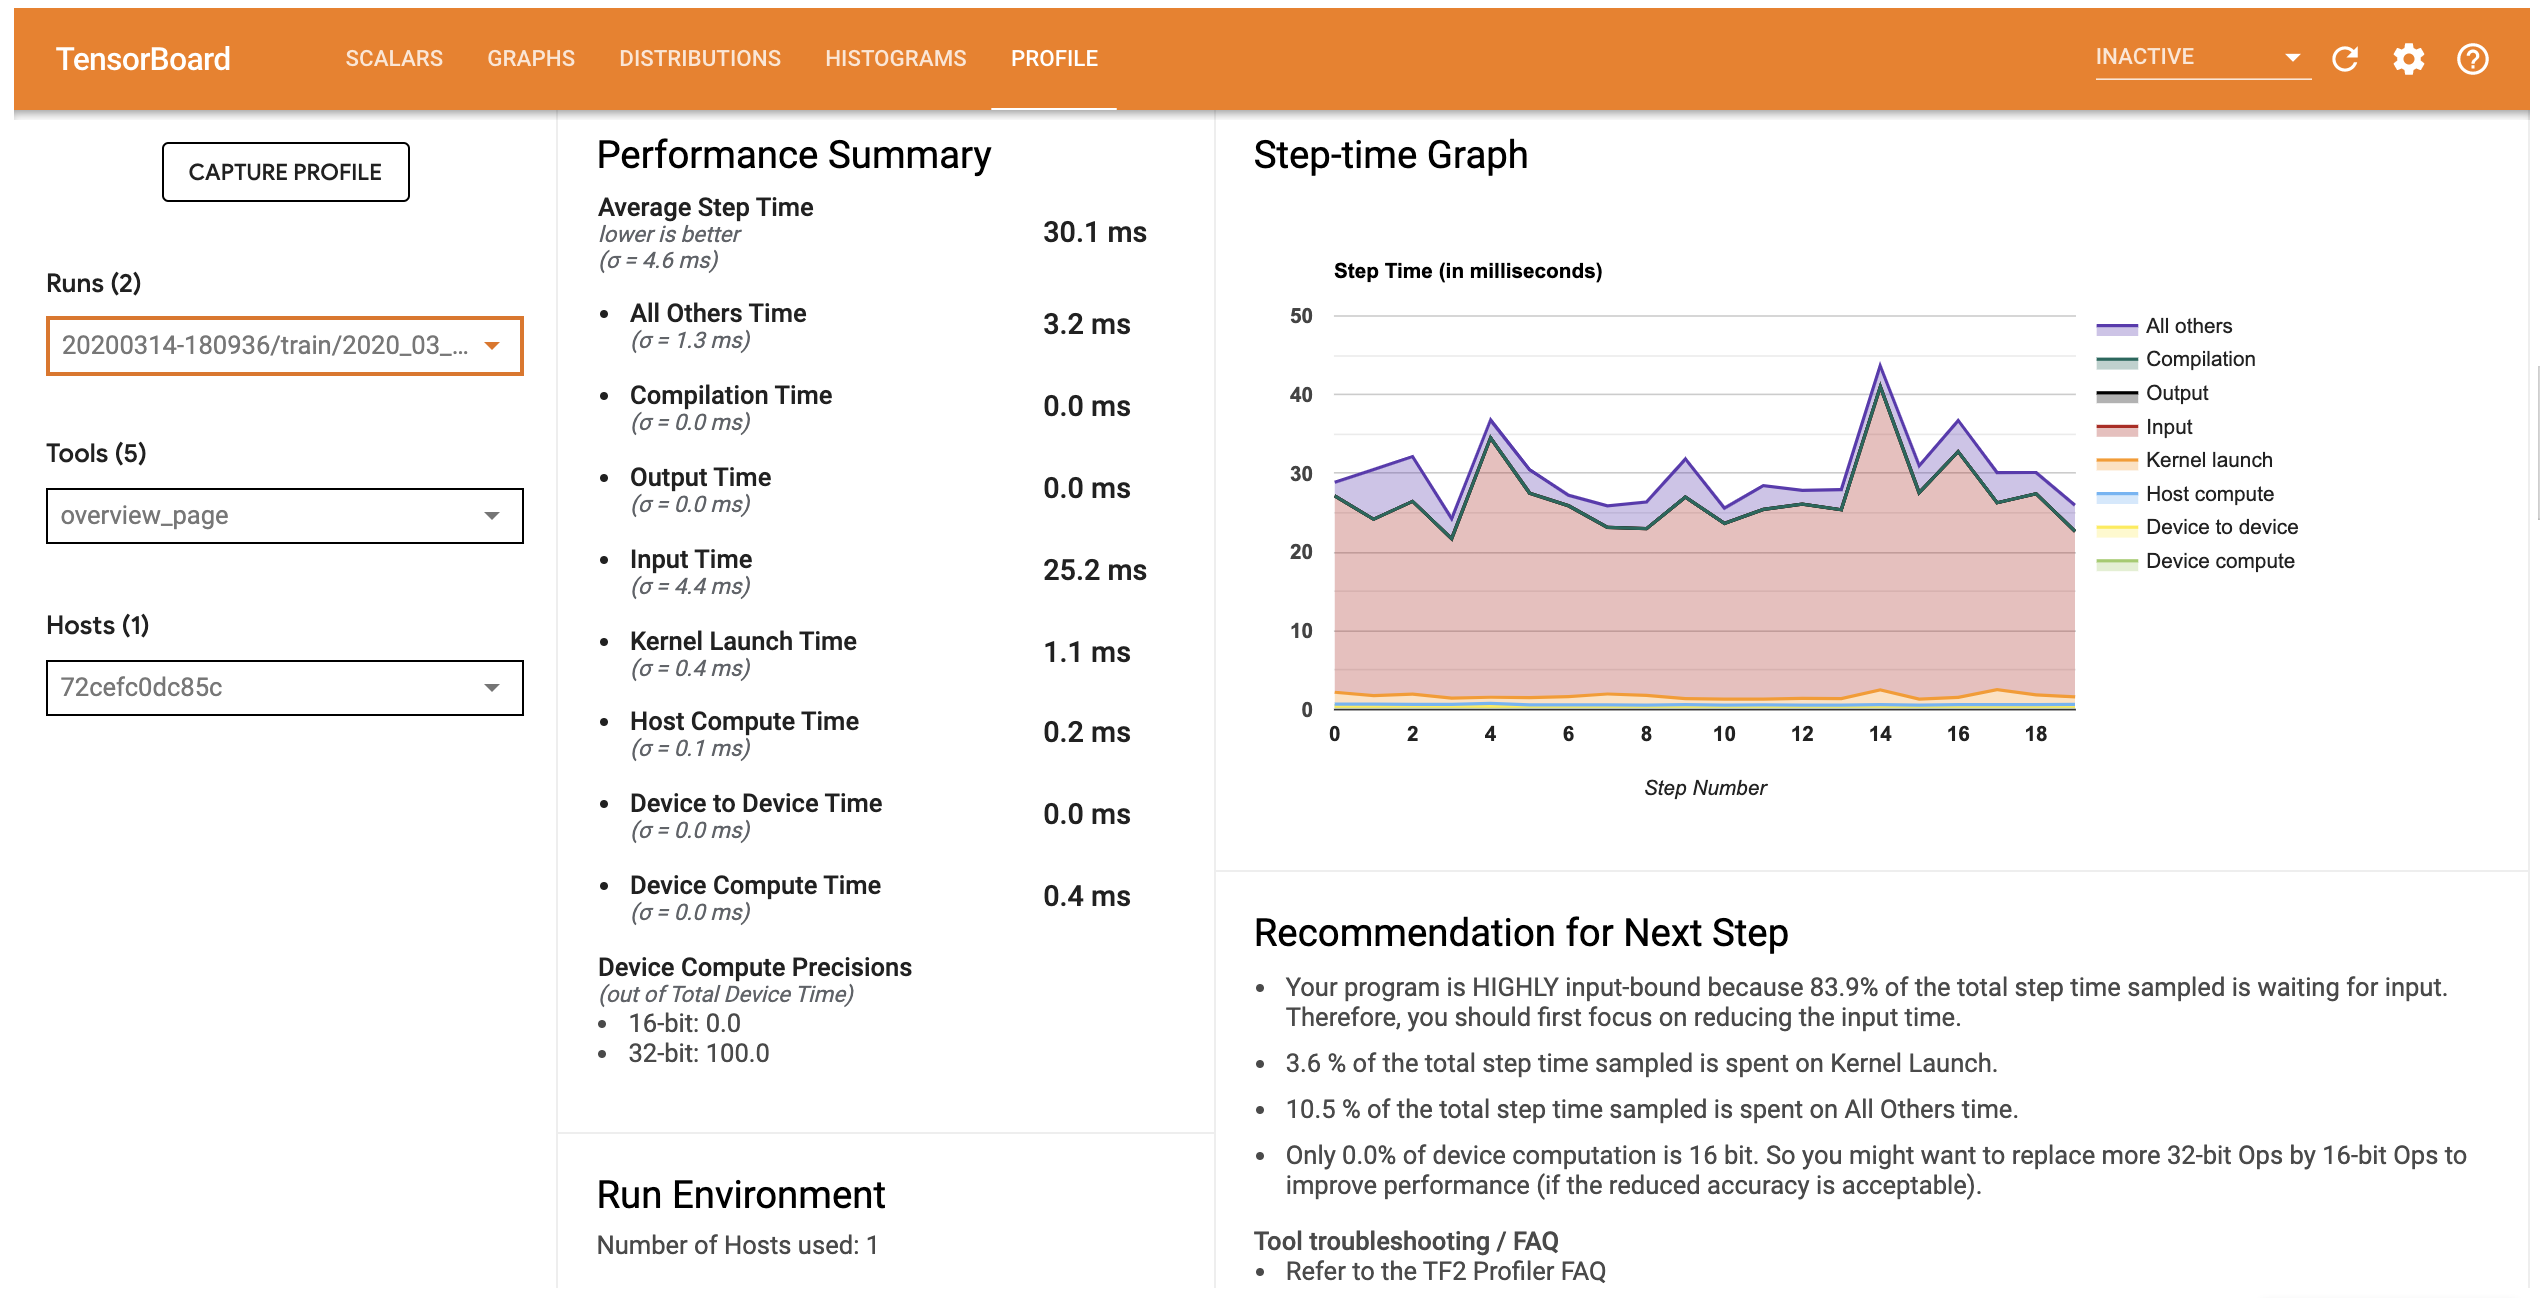
An Input-Bound Example. Source
The official documentation demonstrates how to use the profiler with the Keras interface via a callback(tf.keras.callbacks.TensorBoard). However, there are no mentions of custom training loops. I did some research and came up with a working solution, which will be described in this post, along with some obstacles I had met and how I overcame them.
Preparation
Install the Latest Tensorflow and the Profiler Plugin
This comes directly from the documentation:
## Uninstall twice to uninstall both the 1.15.0 and 2.1.0 version of TensorFlow and TensorBoard.
pip uninstall -y -q tensorflow tensorboard
pip uninstall -y -q tensorflow tensorboard
pip install -U -q tf-nightly tb-nightly tensorboard_plugin_profile
(This will no longer be required once Tensorflow and TensorBoard 2.2 are released)
NVIDIA GPU Libraries
(This section is for training on a single GPU. For training on multiple GPUs, please refer to this guide.)
You’ll need to install NVIDIA GPU drivers and CUDA Toolkit as you normally do when training models on GPU.
The next step is more specifically for the profiler. First, make sure that CUPTI 10.1 exists on the path (source):
/sbin/ldconfig -N -v $(sed 's/:/ /g' <<< $LD_LIBRARY_PATH) | grep libcupti
If not, update the LD_LIBRARY_PATH environment variable:
export LD_LIBRARY_PATH=/usr/local/cuda/extras/CUPTI/lib64:$LD_LIBRARY_PATH
Troubleshoot: CUPTI_ERROR_INSUFFICIENT_PRIVILEGES
You’ll likely see CUPTI_ERROR_INSUFFICIENT_PRIVILEGES and CUPTI_ERROR_INVALID_PARAMETER errors in the log when trying to profile your model. This is because NVIDIA GPU performance counters, when running on one of the newer drivers, is only available to system administrators.
Please read this document from NVIDIA to find a solution to your system.
For my Linux system, the recommended modprobe nvidia NVreg_RestrictProfilingToAdminUsers=0 does not work. An alternative solution, which writes a file to /etc/modprobe.d, works for me. It is also offered in this Github thread:
Adding
options nvidia "NVreg_RestrictProfilingToAdminUsers=0"to/etc/modprobe.d/nvidia-kernel-common.confand reboot should resolve the permision issue.
Profile the Training Loop
This guide(Profile Tensorflow performance) describes four ways to collect performance data. One of them is specific to Keras interface. Another one(sampling mode) is interactive through Tensorboard web UI. I’ll describe the two that works programmatically and are compatible with custom training loops.
tf.profiler.experimental.start('logdir')
## Train the model here
tf.profiler.experimental.stop()
with tf.profiler.experimental.Profile('logdir'):
    # Train the model here
    pass
There is one additional way. By reading the source code of the Keras Tensorboard callback, I reconstructed the Tensorflow Profiler part in the callback as:
from tensorflow.python.profiler import profiler_v2 as profiler

profiler.warmup()
profiler.start(logdir='logdir')
## Train the model here
profiler.stop()
A Working Example
Here is an example that trains an Efficientnet-B3 model and collect performance data using two different ways(with no obvious differences in results):
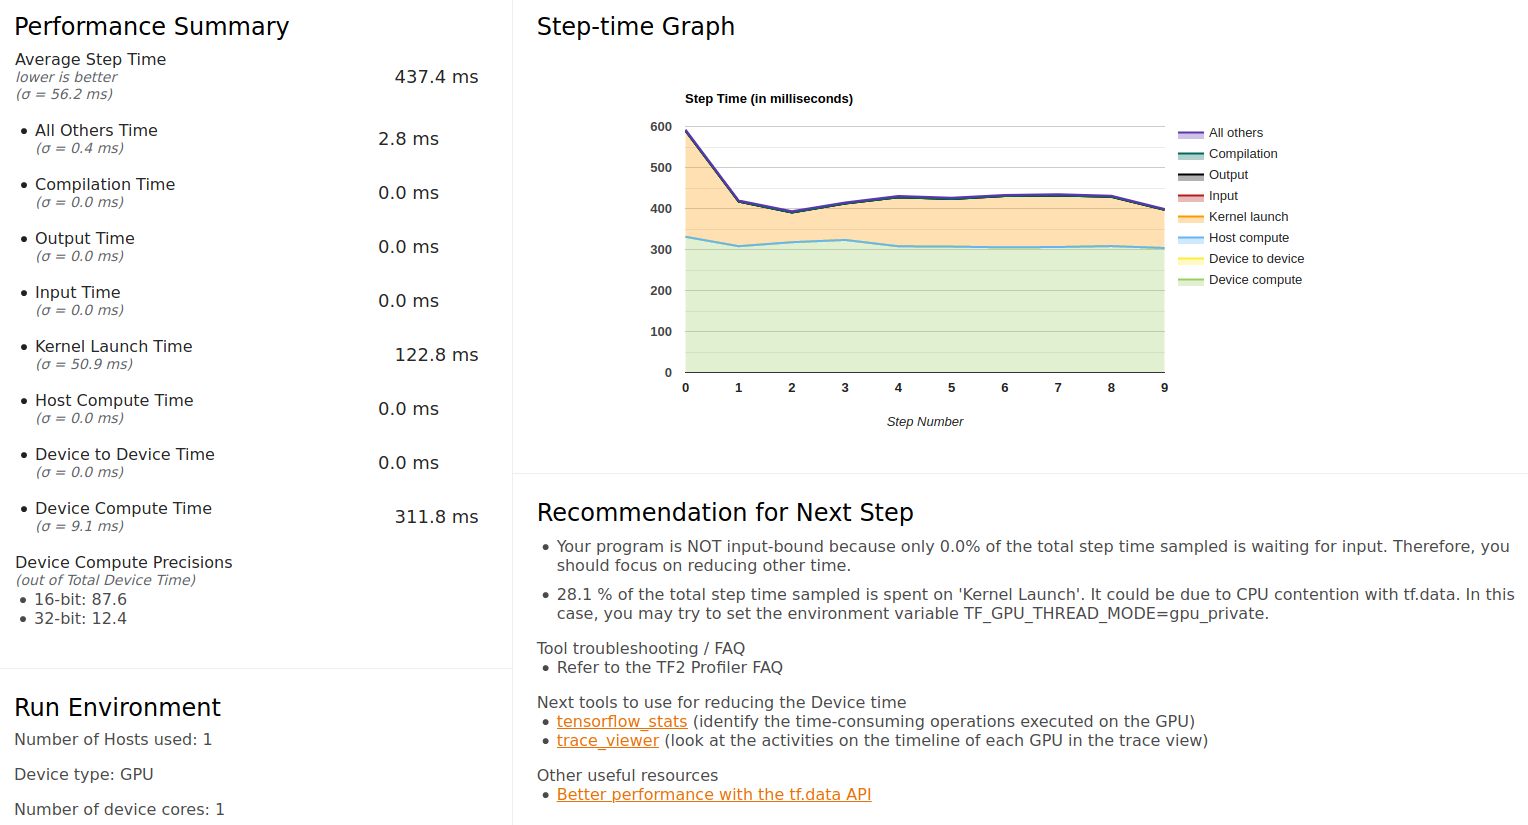
overview_page
Notice that the Device Compute Precisions indicates that 87.6% of the GPU time was spent in 16-bit computation, showing that the mixed-precision training is configured correctly. Judging from the graph, the GPU is well fed with basically no time spent on waiting for input (I enabled prefetch in the data pipeline, so this tells us that it hadn’t run out of the prefetched batches).
The input_pipeline_analyzer page shows that most time on host(CPU side) is spent on data preprocessing, so disk IO doesn’t seem to be a problem:
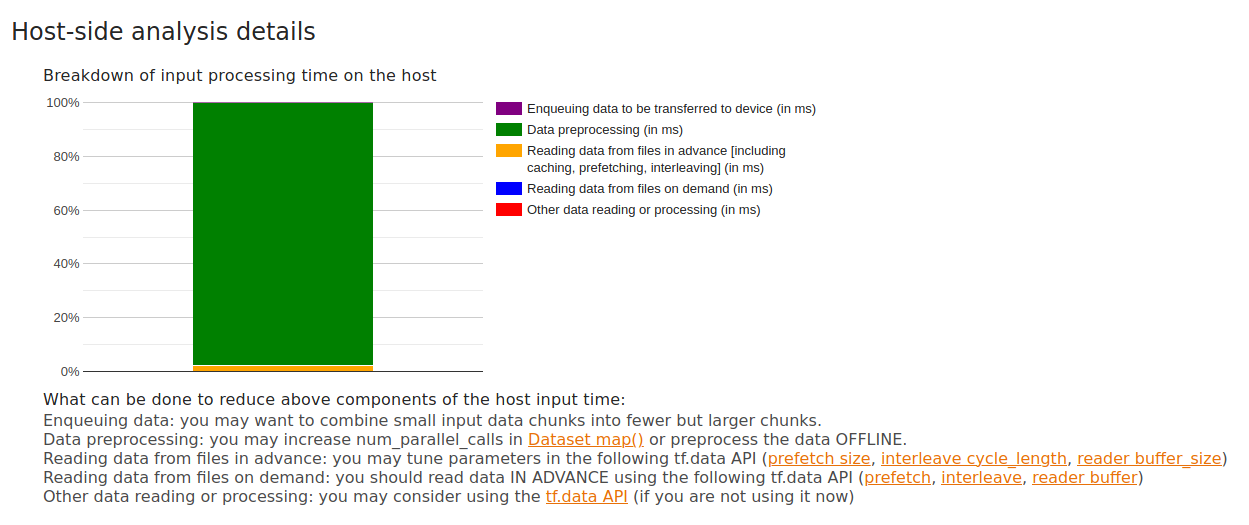
input_pipeline_analyzer
The kernel_stats page shows that 25% of the time is spent on SwapDimension1And2InTensor3UsingTiles. I’m not sure swapping dimensions should take up that much time (doesn’t seem so). Some more research is required to answer that. The page also provides a helpful indication of whether an Op is Tensor Core eligible and whether Tensor Cores were actually used:
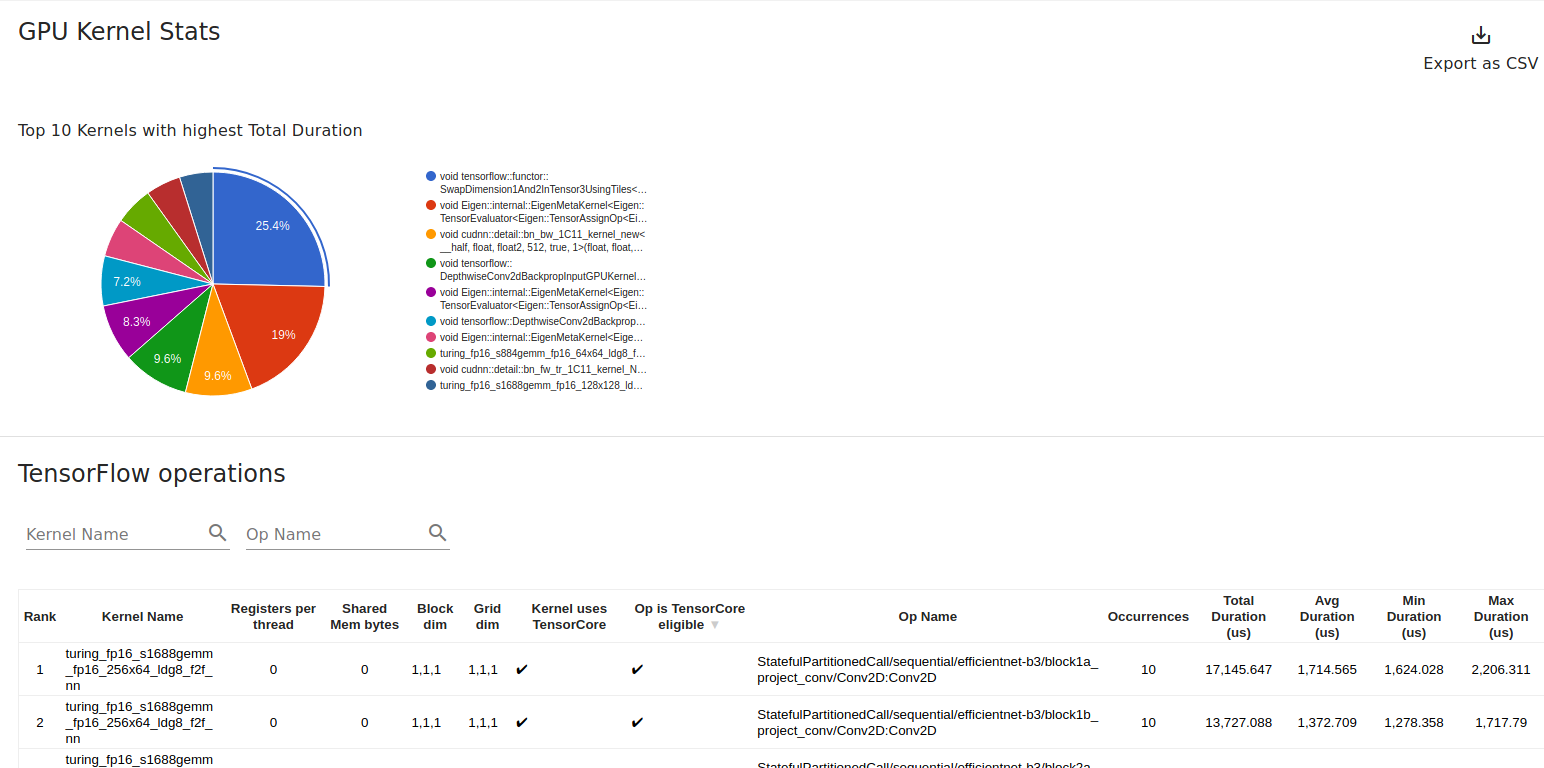
kernel_stats
The notebook used (I used my library tf-helper-bot to wrap my custom training loop in a Fast.ai-inspired API. ):
Conclusion
Thanks for reading! Hopefully this post shows to you that Tensorflow Profiler is a powerful and easy-to-use tool (once you overcome the installation hurdles) that can potentially save you tons of time.
This post only covers part of the profiler capabilities. There are a lot of things I don’t fully understand yet. The profiling report should give you some sense of where to look. I’d love to know if you found any other interesting resources on this topic (leave a comment!).