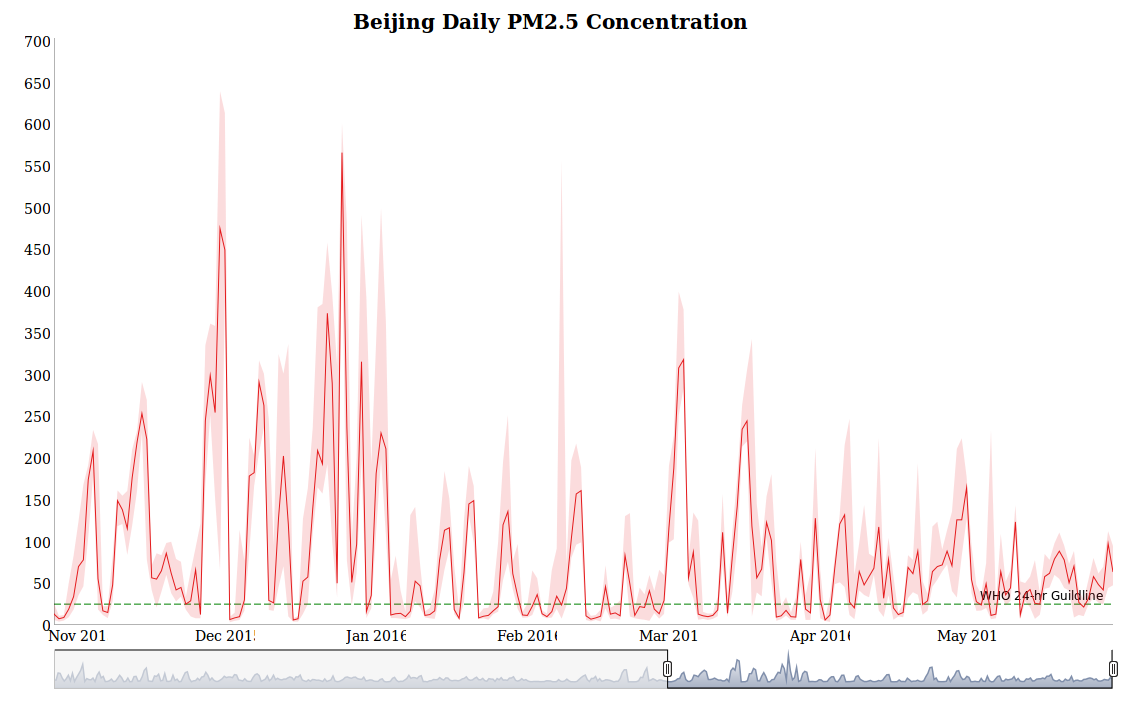
Plotted with R package dygraphs. (Click the image to access the interactive version) Source: US Embassy Source: WHO guideline p.279